More Maps of Foreclosures and Subprime Mortgages
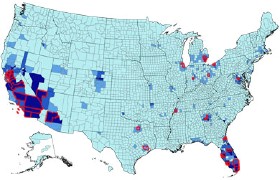 USA Today’s map of 2006 and 2008 foreclosures shows “that rising rates of foreclosure were most severe in a few areas. Last year, 35 counties accounted for half the nation’s foreclosure actions.” (Those counties are outlined in red on the map, reproduced at right.) Via The Electoral Map.
Another interactive map from the New York Times, this one showing subprime mortgages in New York, New Jersey and Connecticut. Zoom in to get more than county-by-county detail. (At the right of the map there’s a bit of a blooper.) Via Google Earth Design.

Comments
blog comments powered by Disqus