A Look at The Map Room’s Traffic
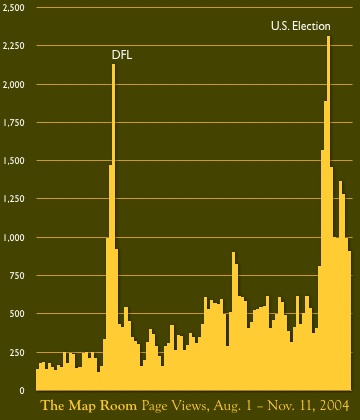
Site owners are invariably far more interested in their sites’ traffic stats than their readers are, but I hope you won’t mind this brief digression. Have a look at the daily page views (I don’t have discrete daily visitor stats) from August 1st to last Thursday.

Traffic peaked sharply in two instances. First, there was some secondary traffic from the vast influx of people checking out DFL in late August: The Map Room was listed on the sidebar as one of my other projects. The second big spike — this month’s — came from people using search engines to find election results maps; many of them ended up in the News and Politics category archives or at earlier individual posts; the newer posts for the 2004 U.S. presidential election either had not yet been made or had not yet been indexed by the search engines.
Otherwise it’s been a surprisingly steady increase, from an average of 144 page views per day in July, to 361 per day in September, to 516 per day in October (to use months without outliers). Traffic tends to be highest from Monday to Thursday, and tapers off from Friday to Sunday — you slackers.
(You know, it probably didn’t hurt that I increased the posting rate in September after several months of posting rather infrequently.)

Comments
blog comments powered by Disqus